USA Flights
Transportation Network
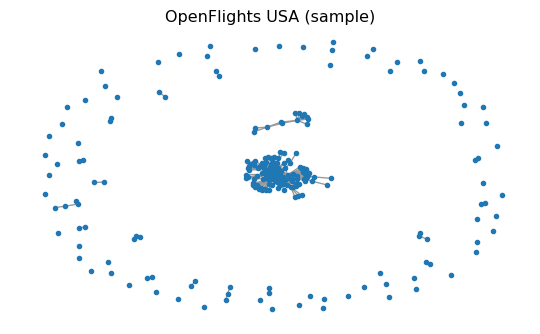
The OpenFlights USA dataset represents airports as nodes and flight routes as edges. It is commonly used to study connectivity, robustness, and hub structure.
Load the graph
The dataset is provided as GraphML and edge lists under data/openflights.
import networkx as nx

G = nx.read_graphml("data/openflights/openflights_usa.graphml.gz")
Basic checks
Try these metrics:
num_nodes = G.number_of_nodes()
num_edges = G.number_of_edges()
avg_degree = sum(dict(G.degree()).values()) / num_nodes

print(num_nodes, num_edges, avg_degree)
Explore hubs
Compute the top airports by degree centrality.
import networkx as nx

centrality = nx.degree_centrality(G)
# TODO: sort and print top 10 airports
Hint: Top 10 by degree (click to expand)
centrality = nx.degree_centrality(G)
top10 = sorted(centrality.items(), key=lambda x: x[1], reverse=True)[:10]
print(top10)
Questions to explore
- Which airports act as hubs?
- How does the network change if you remove the top hub?
- Is the graph connected, or are there isolated components?