Sensitivity and Chaos
Module 1: Low-Dimensional Dynamics
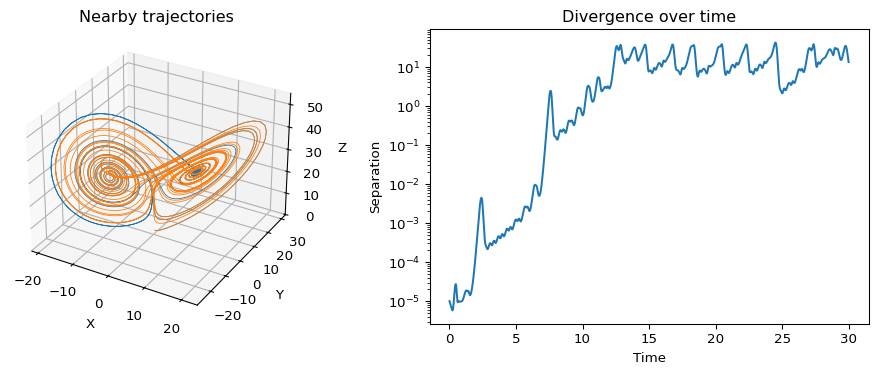
The Lorenz attractor is deterministic, but long-term prediction is still limited because nearby trajectories diverge over time (Lorenz 1963; Strogatz 2024). This is sensitivity to initial conditions. On the attractor the separation grows on average like \(e^{\lambda t}\), with a largest Lyapunov exponent \(\lambda \approx 0.9\) for the standard parameters (Strogatz 2024, sec. 9.3).
Explore sensitive dependence
The figure runs the same computation as the code on this page: forward Euler with \(dt = 0.01\) for 3000 steps, run A from \((0, 1, 1.05)\) and run B from the same point with \(z\) increased by \(\delta\).
- With \(\delta = 10^{-5}\), when are the two runs 1 apart? Before that time, can you tell them apart in the left panel?
- Make \(\delta\) a thousand times smaller, \(10^{-8}\). How much later do the runs separate? What does a thousandfold better measurement buy you?
- Compare the red curve with the dashed slope \(\lambda \approx 0.9\). Why does the separation stop growing at around 10 to 30?
- Set \(r = 10\). What happens to the separation now, and where do both runs end? Check against \(C^\pm = \bigl(\pm\sqrt{b(r-1)}, \pm\sqrt{b(r-1)}, r - 1\bigr)\).
Build this in Python. In the lab you write lorenz() and simulate_lorenz() with forward Euler, run two nearby initial conditions and plot their separation, which is exactly this figure: Practice: Lorenz System. The code on the rest of this page is your starting point.
Compare two nearby initial conditions
To test sensitivity, keep the parameters fixed and change only the initial state by a tiny amount.
initial_state_a = (0.0, 1.0, 1.05)
initial_state_b = (0.0, 1.0, 1.05001)

trajectory_a = simulate_lorenz(initial_state=initial_state_a, dt=0.01, num_steps=3000)
trajectory_b = simulate_lorenz(initial_state=initial_state_b, dt=0.01, num_steps=3000)
At first, the two runs are nearly indistinguishable. Later, they separate enough that their detailed future motion no longer matches.
Measure the separation
The most direct diagnostic is the Euclidean distance between the two trajectories at each time step:
\[ d_n = \left\|\mathbf{x}_n^{(1)} - \mathbf{x}_n^{(2)}\right\|. \]
separation = np.linalg.norm(trajectory_a - trajectory_b, axis=1)
times = 0.01 * np.arange(len(separation))

plt.semilogy(times, separation)
plt.xlabel("Time")
plt.ylabel("Separation")
plt.show()
If the separation grows rapidly from a tiny initial perturbation, then the predictability horizon is short even though the equations themselves are deterministic.
What chaos means here
In this context, chaos does not mean that the model is random.
- The update rule is fixed.
- The same initial condition gives the same trajectory.
- Small errors in the initial state can still lead to very different long-run outcomes.
This is why deterministic chaos matters in modeling. Exact equations do not guarantee exact long-term forecasts.
Parameter variation
The parameter r strongly influences the geometry of the trajectories. A useful first comparison is to simulate one run with a smaller value such as r=10 and another with the standard value r=28.
trajectory_low_r = simulate_lorenz(dt=0.01, num_steps=3000, r=10)
trajectory_standard = simulate_lorenz(dt=0.01, num_steps=3000, r=28)
That comparison helps separate two ideas:
- sensitivity to initial conditions at fixed parameters,
- and qualitative changes driven by the parameter regime.
References
Lorenz, Edward N. 1963. “Deterministic Nonperiodic Flow.” Journal of the Atmospheric Sciences 20 (2): 130–41. https://doi.org/10.1175/1520-0469(1963)020<0130:DNF>2.0.CO;2.
Strogatz, Steven H. 2024. Nonlinear Dynamics and Chaos: With Applications to Physics, Biology, Chemistry, and Engineering. Chapman; Hall/CRC.