This page is self-study material for Session 23. It uses the definitions of Network Concepts.
This page measures density, paths, connected components and distances in undirected graphs with networkx(Newman 2018). See NetworkX Basics if you need a refresher on building graphs.
Start by importing the libraries and creating a small undirected graph.
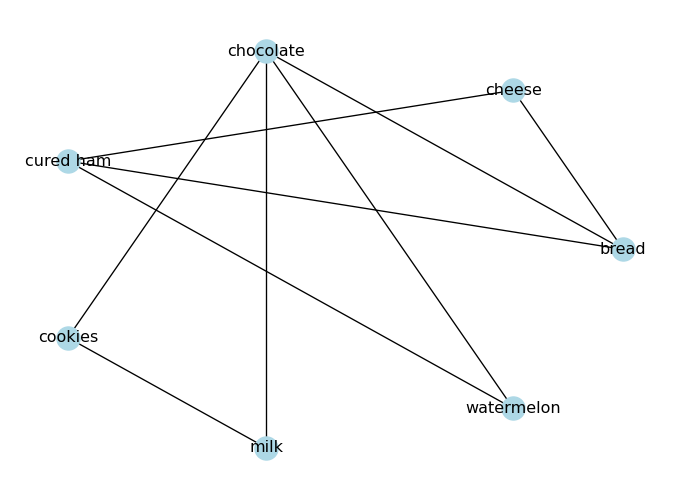
import networkx as nximport matplotlib.pyplot as plt# Create an undirected graph# (foods that go well together)G_foods = nx.from_edgelist([ ("bread", "cheese"), ("bread", "chocolate"), ("bread", "cured ham"), ("cheese", "cured ham"), ("chocolate", "cookies"), ("chocolate", "milk"), ("chocolate", "watermelon"), ("cookies", "milk"), ("cured ham", "watermelon"),])# Visualize the graphpos = nx.circular_layout(G_foods)nx.draw(G_foods, node_color="lightblue", with_labels=True, pos=pos)plt.show()
Density
A graph density is the ratio of the number of edges to the number of possible edges. It is a measure of how many edges are present in the graph compared to the maximum possible number of edges. The density of an undirected graph can be calculated as follows:
\[
D = \frac{2|E|}{|V|(|V| - 1)}
\]
where \(|E|\) is the number of edges and \(|V|\) is the number of nodes in the graph.
In a directed graph, there are twice as many possible edges (since each pair of nodes can have two directed edges), so the density is calculated as:
\[
D = \frac{|E|}{|V|(|V| - 1)}
\]
NetworkX provides a built-in function to calculate the density of a graph:
# Densityprint("Density:", nx.density(G_foods))
Density: 0.42857142857142855
A graph is sparse when \(D \ll 1\) and dense when \(D \approx 1\). In practice, many real graphs fall in an intermediate range, so density is often better viewed as a spectrum rather than a strict binary label.
# Check if the graph is sparse, intermediate, or denseD = nx.density(G_foods)if D <0.1:print("The graph is sparse.")elif D >0.6:print("The graph is dense.")else:print("The graph has intermediate density.")
The graph has intermediate density.
Connectivity in Undirected Graphs
Connectivity is a fundamental property of graphs that describes how well the nodes are connected to each other. In an undirected graph, a graph is connected if there is a path between any two nodes. If a graph is not connected, it consists of multiple connected components, which are subgraphs in which any two nodes are connected by a path.
Paths in an Undirected Graph
A path in a network is a sequence of edges connecting two nodes.
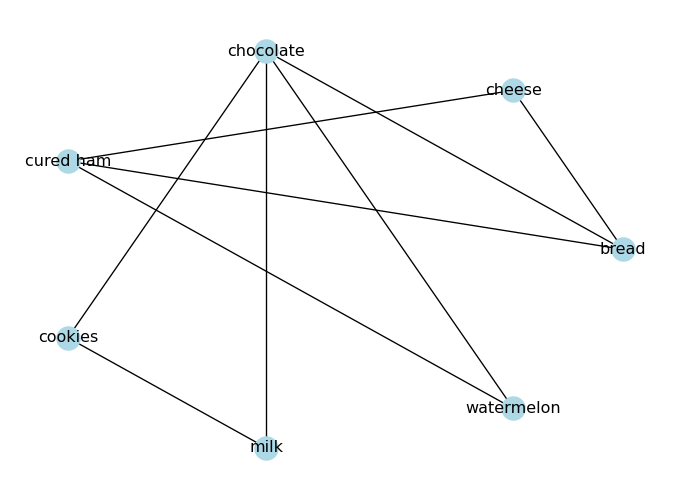
Take a look at the food graph you created above. Is there a path from “bread” to “watermelon”?
# Draw the graphpos = nx.circular_layout(G_foods)nx.draw(G_foods, node_color="lightblue", with_labels=True, pos=pos)plt.show()
NetworkX provides has_path(<graph>, <node1>, <node2>) to check if there is a path between two nodes:
# Check if there is a path from 'bread' to 'watermelon'print("Is there a path from 'bread' to 'watermelon'?", nx.has_path(G_foods, "bread", "watermelon"))
Is there a path from 'bread' to 'watermelon'? True
There can be more than one path between two nodes. You can use all_simple_paths(<graph>, <node1>, <node2>) to find all the simple paths between two nodes:
ls_paths =list(nx.all_simple_paths(G_foods, "bread", "watermelon"))print("All paths from 'bread' to 'watermelon':", ls_paths)
All paths from 'bread' to 'watermelon': [['bread', 'cheese', 'cured ham', 'watermelon'], ['bread', 'chocolate', 'watermelon'], ['bread', 'cured ham', 'watermelon']]
Connected Components in Undirected Graphs
A connected component is a subgraph in which any two nodes are connected by a path. A graph is connected if it has only one connected component.
Exercise
How many connected components does G_foods have? Answer from the drawing, then check with nx.connected_components.
Solution
G_foods has one connected component, since all nodes are connected to each other through some path.
The diameter of a graph is the length of the longest shortest path between any two nodes in the graph. It gives an idea of how “far apart” the nodes are in the graph.
print("Diameter:", nx.diameter(G_foods))
Diameter: 3
The average path length (APL) is the average of the shortest paths between all pairs of nodes.
Newman, Mark. 2018. Networks. 2nd ed. Oxford University Press.
Source Code
---title: "Paths and Components"subtitle: "Module 5: Complex Networks"format: html---::: {.callout-note}## Toolkit pageThis page is self-study material for Session 23. It uses the definitions of [Network Concepts](network-concepts.qmd).:::This page measures **density**, **paths**, **connected components** and **distances** in undirected graphs with `networkx`[@newman2018networks]. See [NetworkX Basics](networkx-basics.qmd) if you need a refresher on building graphs.Start by importing the libraries and creating a small undirected graph.```{python}import networkx as nximport matplotlib.pyplot as plt# Create an undirected graph# (foods that go well together)G_foods = nx.from_edgelist([ ("bread", "cheese"), ("bread", "chocolate"), ("bread", "cured ham"), ("cheese", "cured ham"), ("chocolate", "cookies"), ("chocolate", "milk"), ("chocolate", "watermelon"), ("cookies", "milk"), ("cured ham", "watermelon"),])# Visualize the graphpos = nx.circular_layout(G_foods)nx.draw(G_foods, node_color="lightblue", with_labels=True, pos=pos)plt.show()```## DensityA graph density is the ratio of the number of edges to the number of possible edges. It is a measure of how many edges are present in the graph compared to the maximum possible number of edges. The density of an undirected graph can be calculated as follows:$$D = \frac{2|E|}{|V|(|V| - 1)}$$where $|E|$ is the number of edges and $|V|$ is the number of nodes in the graph.In a directed graph, there are twice as many possible edges (since each pair of nodes can have two directed edges), so the density is calculated as:$$D = \frac{|E|}{|V|(|V| - 1)}$$NetworkX provides a built-in function to calculate the density of a graph:```{python}# Densityprint("Density:", nx.density(G_foods))```A graph is **sparse** when $D \ll 1$ and **dense** when $D \approx 1$.In practice, many real graphs fall in an intermediate range, so density is often better viewed as a spectrum rather than a strict binary label.```{python}# Check if the graph is sparse, intermediate, or denseD = nx.density(G_foods)if D <0.1:print("The graph is sparse.")elif D >0.6:print("The graph is dense.")else:print("The graph has intermediate density.")```## Connectivity in Undirected GraphsConnectivity is a fundamental property of graphs that describes how well the nodes are connected to each other. In an undirected graph, a graph is **connected** if there is a path between any two nodes. If a graph is not connected, it consists of multiple **connected components**, which are subgraphs in which any two nodes are connected by a path.### Paths in an Undirected GraphA **path** in a network is a sequence of edges connecting two nodes.Take a look at the food graph you created above. Is there a path from "bread" to "watermelon"?```{python}# Draw the graphpos = nx.circular_layout(G_foods)nx.draw(G_foods, node_color="lightblue", with_labels=True, pos=pos)plt.show()```NetworkX provides `has_path(<graph>, <node1>, <node2>)` to check if there is a path between two nodes:```{python}# Check if there is a path from 'bread' to 'watermelon'print("Is there a path from 'bread' to 'watermelon'?", nx.has_path(G_foods, "bread", "watermelon"))```There can be more than one path between two nodes. You can use `all_simple_paths(<graph>, <node1>, <node2>)` to find all the simple paths between two nodes:```{python}ls_paths =list(nx.all_simple_paths(G_foods, "bread", "watermelon"))print("All paths from 'bread' to 'watermelon':", ls_paths)```### Connected Components in Undirected GraphsA **connected component** is a subgraph in which any two nodes are connected by a path. A graph is **connected** if it has only one connected component.::: {.callout-note}## ExerciseHow many connected components does `G_foods` have? Answer from the drawing, then check with `nx.connected_components`.:::::: {.callout-tip collapse="true"}## Solution`G_foods` has one connected component, since all nodes are connected to each other through some path.```{python}print("Connected components:", list(nx.connected_components(G_foods)))```:::### Diameter and Average Path LengthThe **diameter** of a graph is the length of the longest shortest path between any two nodes in the graph. It gives an idea of how "far apart" the nodes are in the graph.```{python}print("Diameter:", nx.diameter(G_foods))```The **average path length (APL)** is the average of the shortest paths between all pairs of nodes.```{python}print("Average shortest path length:", nx.average_shortest_path_length(G_foods))```## What's Next?The next page repeats these measurements on a directed graph, where paths must follow the direction of the edges.[Paths in Directed Graphs](networkx-directed-paths.qmd){.btn .btn-primary}