Connectivity in directed graphs is more complex than in undirected graphs, because you have to consider the direction of the edges. In a directed graph, you can have strongly connected components and weakly connected components.
Paths in Directed Graphs
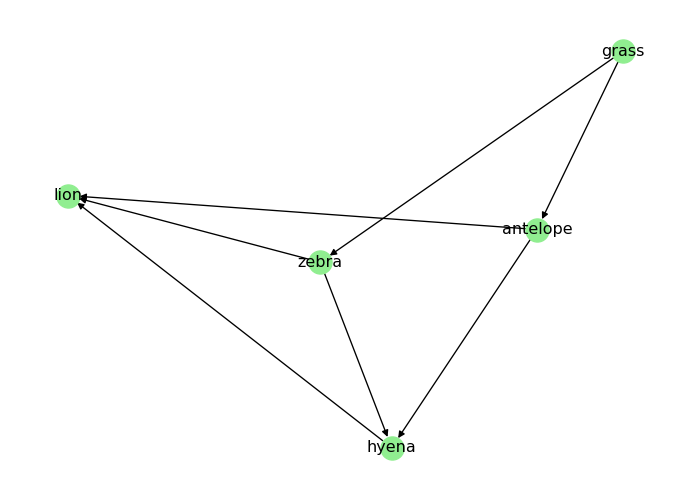
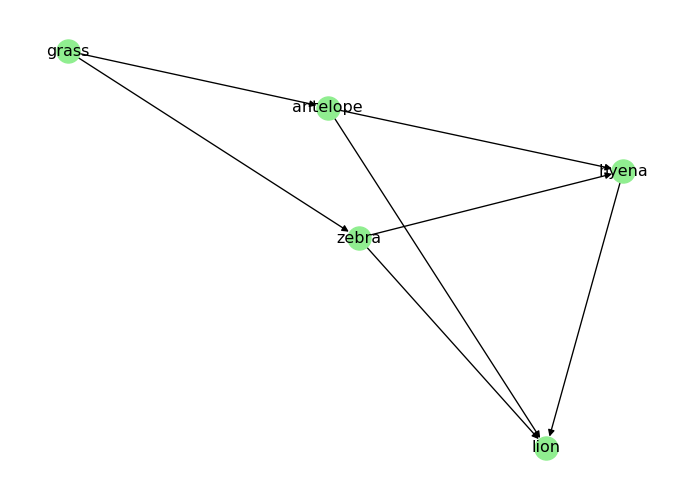
In a directed graph, a path must follow the direction of the edges. For example, in the directed food chain graph D_food_chain, is there a path from “grass” to “lion”?
# Draw the graphpos = nx.spring_layout(D_food_chain)nx.draw(D_food_chain, node_color="lightgreen", with_labels=True, pos=pos)plt.show()
You can check for the existence of a path in a directed graph using the same has_path(<graph>, <node1>, <node2>) function:
print("Is there a path from 'grass' to 'lion'?", nx.has_path(D_food_chain, "grass", "lion"))
print("Is there a path from 'lion' to 'grass'?", nx.has_path(D_food_chain, "lion", "grass"))
Is there a path from 'grass' to 'lion'? True
Is there a path from 'lion' to 'grass'? False
Strongly Connected Components
A strongly connected component is a subgraph in which there is a directed path from any node to any other node. A directed graph is strongly connected if it has only one strongly connected component.
A weakly connected component is a subgraph in which there is an undirected path from any node to any other node. A directed graph is weakly connected if it has only one weakly connected component.
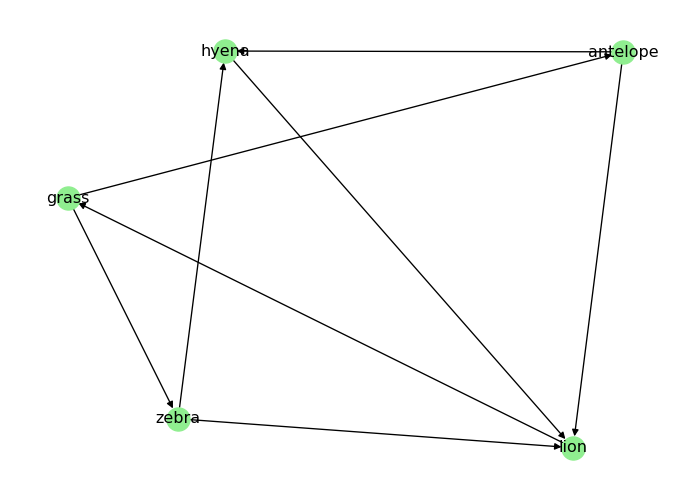
How can you turn D_food_chain into a strongly connected graph? Add as few edges as possible.
Solution
To make D_food_chain strongly connected, you need to ensure that there is a directed path from every node to every other node. One way to achieve this is to add edges that create cycles between the nodes. This example is a tough one, as food chains are typically acyclic. Still, you can take note from “The Lion King”:
“When we die, our bodies become the grass, and the antelope eat the grass. And so, we are all connected in the great Circle of Life.” - Mufasa (lion)
# When a predator dies, it returns to the food chain as prey for the grassD_food_chain.add_edges_from([ ("lion", "grass"),])# Visualize the new graphpos = nx.spring_layout(D_food_chain)nx.draw(D_food_chain, node_color="lightgreen", with_labels=True, pos=pos)plt.show()
Diameter and Average Path Length in Directed Graphs
The diameter and average path length in directed graphs are calculated based on the shortest paths that follow the direction of the edges. If the graph is not strongly connected, you can only calculate these metrics for the largest strongly connected component.
# Get the largest strongly connected componentlargest_scc =max(nx.strongly_connected_components(D_food_chain), key=len)subgraph = D_food_chain.subgraph(largest_scc)print("Diameter of the largest strongly connected component:", nx.diameter(subgraph))print("Average shortest path length of the largest strongly connected component:", nx.average_shortest_path_length(subgraph))
Diameter of the largest strongly connected component: 3
Average shortest path length of the largest strongly connected component: 1.85
What’s Next?
The next page computes degrees and clustering coefficients.
---title: "Paths in Directed Graphs"subtitle: "Module 5: Complex Networks"format: html---::: {.callout-note}## Toolkit pageThis page is self-study material for Session 23. It continues [Paths and Components](networkx-paths.qmd).:::Start with a small directed graph: a food chain where each edge points from prey to predator.```{python}import networkx as nximport matplotlib.pyplot as plt# Create a directed graphD_food_chain = nx.DiGraph() # food chain (prey -> predator)D_food_chain.add_edges_from([ ("grass", "antelope"), ("grass", "zebra"), ("antelope", "lion"), ("antelope", "hyena"), ("zebra", "lion"), ("zebra", "hyena"), ("hyena", "lion"),])# Visualize the graphpos = nx.spring_layout(D_food_chain)nx.draw(D_food_chain, node_color="lightgreen", with_labels=True, pos=pos)plt.show()```## Connectivity in Directed GraphsConnectivity in directed graphs is more complex than in undirected graphs, because you have to consider the direction of the edges. In a directed graph, you can have **strongly connected components** and **weakly connected components**.### Paths in Directed GraphsIn a directed graph, a path must follow the direction of the edges. For example, in the directed food chain graph `D_food_chain`, is there a path from "grass" to "lion"?```{python}# Draw the graphpos = nx.spring_layout(D_food_chain)nx.draw(D_food_chain, node_color="lightgreen", with_labels=True, pos=pos)plt.show()```You can check for the existence of a path in a directed graph using the same `has_path(<graph>, <node1>, <node2>)` function:```{python}print("Is there a path from 'grass' to 'lion'?", nx.has_path(D_food_chain, "grass", "lion")) print("Is there a path from 'lion' to 'grass'?", nx.has_path(D_food_chain, "lion", "grass"))```### Strongly Connected ComponentsA strongly connected component is a subgraph in which there is a directed path from any node to any other node. A directed graph is strongly connected if it has only one strongly connected component.```{python}print("Is strongly connected:", nx.is_strongly_connected(D_food_chain))print("Strongly connected components:", list(nx.strongly_connected_components(D_food_chain)))```### Weakly Connected ComponentsA weakly connected component is a subgraph in which there is an undirected path from any node to any other node. A directed graph is weakly connected if it has only one weakly connected component.```{python}print("Is weakly connected:", nx.is_weakly_connected(D_food_chain))print("Weakly connected components:", list(nx.weakly_connected_components(D_food_chain)))```::: {.callout-note}## ExerciseHow can you turn `D_food_chain` into a strongly connected graph? Add as few edges as possible.:::::: {.callout-tip collapse="true"}## SolutionTo make `D_food_chain` strongly connected, you need to ensure that there is a directed path from every node to every other node. One way to achieve this is to add edges that create cycles between the nodes. This example is a tough one, as food chains are typically acyclic. Still, you can take note from "The Lion King":> "When we die, our bodies become the grass, and the antelope eat the grass. And so, we are all connected in the great Circle of Life." - Mufasa (lion)```{python}# When a predator dies, it returns to the food chain as prey for the grassD_food_chain.add_edges_from([ ("lion", "grass"),])# Visualize the new graphpos = nx.spring_layout(D_food_chain)nx.draw(D_food_chain, node_color="lightgreen", with_labels=True, pos=pos)plt.show()``````{python}print("Is strongly connected:", nx.is_strongly_connected(D_food_chain))print("Strongly connected components:", list(nx.strongly_connected_components(D_food_chain)))```:::### Diameter and Average Path Length in Directed GraphsThe diameter and average path length in directed graphs are calculated based on the shortest paths that follow the direction of the edges. If the graph is not strongly connected, you can only calculate these metrics for the largest strongly connected component.```{python}# Get the largest strongly connected componentlargest_scc =max(nx.strongly_connected_components(D_food_chain), key=len)subgraph = D_food_chain.subgraph(largest_scc)print("Diameter of the largest strongly connected component:", nx.diameter(subgraph))print("Average shortest path length of the largest strongly connected component:", nx.average_shortest_path_length(subgraph))```## What's Next?The next page computes degrees and clustering coefficients.[Degree and Clustering](networkx-degree-clustering.qmd){.btn .btn-primary}