import matplotlib.pyplot as plt
import networkx as nxGraphs from Edge Lists
Module 5: Complex Networks
Toolkit page
This page is self-study material for Session 23. It continues Drawing Attributes.
Creating a Graph from an Edge List
In practice, you often have data in the form of an edge list, which is a list of pairs of nodes that are connected by edges. You can create a graph directly from an edge list using the from_edgelist() method. For example:
# Define the edge list (actors that have worked together in movies)
edge_list = [
    ("Antonio Banderas", "Brad Pitt"),  # Interview with the Vampire (1994)
    ("Antonio Banderas", "Javier Bardem"),  # Automata (2014)
    ("Antonio Banderas", "Penelope Cruz"),  # Dolor y Gloria (2019)
    ("Antonio Banderas", "Tom Holland"),  # Uncharted (2022)
    ("Brad Pitt", "Javier Bardem"),  # F1 (2025)
    ("Javier Bardem", "Timothée Chalamet"),  # Dune (2021)
    ("Timothée Chalamet", "Zendaya"),  # Dune (2021)
    ("Tom Holland", "Zendaya"),  # Spider-Man: No Way Home (2021)
]

# Create a graph from the edge list
G_actors = nx.from_edgelist(edge_list)
# Draw the graph
pos = nx.spring_layout(G_actors, k=0.15, iterations=20)
# k is the optimal distance between nodes (default 1/sqrt(N))
# iterations is the number of force-directed update steps (default 50)

nx.draw(
    G_actors,
    pos=pos,
    with_labels=True,
    node_color='lightgreen',
    edge_color='gray',
    node_size=2000,
    font_size=12
    )
plt.show()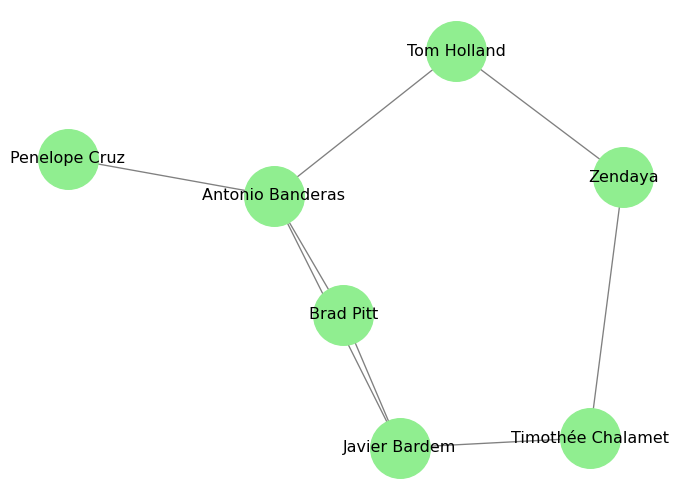
Exercise
The comments next to the edges name the movie each pair made together. Build a graph whose edges carry a movie attribute and draw it with the movie titles as edge labels.
movies = [
    ("Antonio Banderas", "Brad Pitt", "Interview with the Vampire"),
    # TODO: the other seven pairs with their movie
]
G_movies = nx.Graph()
for a, b, title in movies:
    # TODO: add the edge with a movie attribute
    pass

pos = nx.spring_layout(G_movies, seed=1)
nx.draw(G_movies, pos=pos, with_labels=True)
# TODO: draw the edge labels with nx.draw_networkx_edge_labels
plt.show()
Solution
movies = [
    ("Antonio Banderas", "Brad Pitt", "Interview with the Vampire"),
    ("Antonio Banderas", "Javier Bardem", "Automata"),
    ("Antonio Banderas", "Penelope Cruz", "Dolor y Gloria"),
    ("Antonio Banderas", "Tom Holland", "Uncharted"),
    ("Brad Pitt", "Javier Bardem", "F1"),
    ("Javier Bardem", "Timothée Chalamet", "Dune"),
    ("Timothée Chalamet", "Zendaya", "Dune"),
    ("Tom Holland", "Zendaya", "Spider-Man: No Way Home"),
]
G_movies = nx.Graph()
for a, b, title in movies:
    G_movies.add_edge(a, b, movie=title)

pos = nx.spring_layout(G_movies, seed=1)
nx.draw(G_movies, pos=pos, with_labels=True, node_color="lightgreen", node_size=1500)
nx.draw_networkx_edge_labels(G_movies, pos, edge_labels=nx.get_edge_attributes(G_movies, "movie"))
plt.show()
What’s Next?
The next page measures paths, components and distances.