import networkx as nx
import numpy as np
import matplotlib.pyplot as plt

SEED = 7 # fixed seed for reproducibilityPractice: Real Networks
Module 5: Complex Networks
This is an ungraded practice activity. It does not count towards your grade. It is also a good starting point if you choose a network topic for the group project.
Pick one real network and do two things, in order:
- Characterize the network (basic structural properties).
- Simulate propagation on it:
- Default: epidemics with both SIS and SIR.
- Alternative: a different propagation process (e.g., fake-news spreading).
These networks are meaningful contexts for epidemics:
- Enron email approximates a contact/communication network between people.
- USA Flights approximates a mobility/transport network connecting locations.
Your goal is not only to “run code”, but to justify what you measure, make your results reproducible, and interpret them.
Suggested output
Aim for two things:
- Code: a notebook or script that reproduces all figures and numbers and runs end to end.
- A short write-up with a table of core network metrics, at least one structural plot (for example a degree histogram), the top 10 nodes by degree centrality and by one other centrality measure, propagation figures (mean over several runs), and a short interpretation of the questions under “Discuss”.
State the exact parameters you used: \(\beta\), \(\mu\), initial infected nodes, number of runs and seed protocol.
Setup (Reproducibility)
Use a fixed seed for reproducible results. When running multiple trials, use SEED + r (where r is the trial index) so trials differ but remain reproducible.
Enron email network
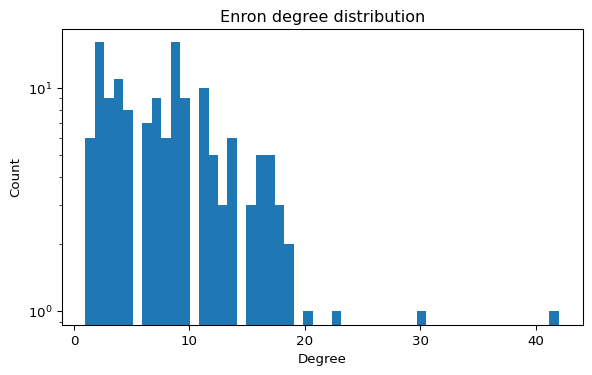
The Enron email dataset can be represented as a graph where nodes are email addresses and edges represent communication. It is widely used to study centrality, communities, and robustness (Leskovec and Krevl 2014).
Load and check the Enron data
Use the local edge list if you cloned this repository:
data/ia-enron-only/ia-enron-only.edges
If you are working from the rendered website and do not have the data/ folder, download the official SNAP file:
https://snap.stanford.edu/data/email-Enron.txt.gz (Leskovec and Krevl 2014)
import networkx as nx

G = nx.read_edgelist("data/ia-enron-only/ia-enron-only.edges")
G = nx.Graph(G)  # ensure undirected simple graph

print("N, E =", G.number_of_nodes(), G.number_of_edges())
print("Self-loops:", nx.number_of_selfloops(G))
If the graph is disconnected, you may choose to work on the largest connected component for path-based metrics:
largest_cc_nodes = max(nx.connected_components(G), key=len)
H = G.subgraph(largest_cc_nodes).copy()
print("Largest CC size:", H.number_of_nodes())
Basic properties of the Enron network
Using the definitions from Network Concepts and Paths and Components, report at least:
- \(N\), \(E\), average degree, density
- number of connected components + size of largest component
- clustering (average clustering and/or transitivity)
- top-10 nodes by degree centrality + one additional centrality metric (betweenness, PageRank, etc.)
You may also report average shortest path length / diameter on the largest component.
Centrality metrics
Exercise
Compute the betweenness centrality of every node and print the 10 nodes with the highest values.
import networkx as nx

bc = nx.betweenness_centrality(G)
# TODO: sort and print top 10 nodes
Solution
Sort the (node, value) pairs of the dictionary by value, from high to low, and keep the first 10.
import networkx as nx

bc = nx.betweenness_centrality(G)
top10 = sorted(bc.items(), key=lambda item: item[1], reverse=True)[:10]
for node, value in top10:
    print(f"{node}: {value:.3f}")
On the local Enron file, node 105 comes first with a betweenness of about 0.19, far above the next node (about 0.11).
Questions to explore
- Which nodes act as brokers (hubs) in the network?
- How does the graph change if you remove high-betweenness nodes? Your answer will matter for the epidemic simulations later.
- Can you detect communities with a simple algorithm?
The practice continues with the USA flights network, the option to use your own network, and the propagation experiments.
References
Leskovec, Jure, and Andrej Krevl. 2014. “SNAP: Email-Enron.” Stanford Large Network Dataset Collection. https://snap.stanford.edu/data/email-Enron.html.