The Reproduction Number
Module 1: Low-Dimensional Dynamics
The basic reproduction number \(R_0\) is the average number of secondary infections caused by one infectious individual in a fully susceptible population (hethcote2000mathematics?; Keeling and Rohani 2008).
R0 in the SIR model
In the SIR model of Compartmental Models, one infectious person infects susceptibles at rate \(\beta S \approx \beta\) when \(S \approx 1\), during an infectious period of mean length \(1/\gamma\). Hence
\[ R_0 = \frac{\beta}{\gamma} . \tag{1}\]
The threshold
The infectious equation is \(\dot I = \gamma I (R_0 S - 1)\). At the start of an outbreak \(S(0) \approx 1\), so
- \(R_0 > 1\): \(I\) grows at rate \(\gamma(R_0 - 1) = \beta - \gamma\), and an epidemic occurs;
- \(R_0 < 1\): \(I\) decays and the infection dies out.
This is the threshold theorem of Kermack and McKendrick (Kermack and McKendrick 1927; hethcote2000mathematics?). During the epidemic, the relevant quantity is the effective reproduction number \(R_{\text{eff}}(t) = R_0 S(t)\). The number of infectious people peaks exactly when \(R_{\text{eff}} = 1\), that is when \(S = 1/R_0\).
The same threshold appears in the SIS model. The endemic equilibrium of \(\dot I = \beta I(1 - I) - \gamma I\) is
\[ I^* = 1 - \frac{1}{R_0}, \]
which exists and is stable only for \(R_0 > 1\) (hethcote2000mathematics?).
Herd immunity
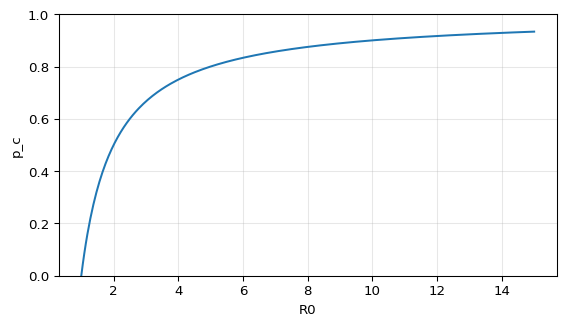
Suppose a fraction \(p\) of the population is immune before the outbreak, so \(S(0) = 1 - p\). An outbreak cannot start if \(R_0 (1 - p) < 1\). The critical immunization fraction is
\[ p_c = 1 - \frac{1}{R_0} . \tag{2}\]
Vaccinating more than \(p_c\) of the population protects the whole population, including those not vaccinated (hethcote2000mathematics?; Keeling and Rohani 2008). The formula assumes random mixing and a vaccine that gives full, lasting immunity.
What R0 does not tell you
- \(R_0\) depends on the disease and on the population: the same pathogen has different \(R_0\) values in different contact patterns (hethcote2000mathematics?).
- In the SIR model, only \(\beta\) and \(\gamma\) together determine the shape of the outbreak. Early data, which grow like \(e^{(\beta - \gamma)t}\), determine \(\beta - \gamma\) but not \(R_0\). You will see the consequences in Predicting the Peak.
Exercise
A disease has \(\beta = 0.3\) per day and a mean infectious period of 10 days. Compute \(R_0\), the early growth rate, the doubling time of cases, and the critical vaccination coverage.
Solution
\(\gamma = 0.1\) per day, so \(R_0 = 3\). The early growth rate is \(\beta - \gamma = 0.2\) per day, giving a doubling time \(\ln 2 / 0.2 \approx 3.5\) days. The critical coverage is \(p_c = 1 - 1/3 \approx 0.67\).
Next
Keeling, Matt J., and Pejman Rohani. 2008. Modeling Infectious Diseases in Humans and Animals. Princeton University Press.
Kermack, William O., and Anderson G. McKendrick. 1927. “A Contribution to the Mathematical Theory of Epidemics.” Proceedings of the Royal Society A 115 (772): 700–721. https://doi.org/10.1098/rspa.1927.0118.